The Wrong Thermometer
Stop quoting the CVE count as if cybersecurity were getting worse


TL;DR: The cybersecurity industry has been reading the CVE count as if it were a passive thermometer of risk, when in fact it is a reflexive instrument — one that catalogs vulnerabilities and, for the subset that gets weaponized, materially causes the exploitation it is meant to prevent, with a measured lag of five hours. This article argues three things: that most of the CVE growth since 2021 is administrative catch-up concentrated in five CNAs and specific ecosystems (WordPress, Linux kernel, OSS); that the metric has become structurally reflexive in the Soros sense, with the added pathology that its costs are externalized to defenders who had no voice in the disclosure; and that better metrics exist (exploitation pressure, weaponization velocity, defensive friction) but nobody publishes them continuously. The practical conclusion: stop anchoring policy, insurance, and strategy to a number that burns what it measures, and start building the dashboard that would replace it.
Every January, someone writes a headline about how cybersecurity got worse last year. The evidence is always the same number: the count of published CVEs grew by 38%, or 21%, or some other double-digit figure. The industry repeats it. Regulators cite it in policy memos. CISOs use it to justify budget requests. Vendors weave it into sales decks.
The number is real. The interpretation is not.
The deeper problem this article tries to address is that the world has been making cybersecurity decisions — budget allocations, regulatory thresholds, insurance pricing, incident disclosures — anchored to a single indicator that does not work the way people assume it works. For twenty-six years we have treated the CVE count as if it were a thermometer taking the temperature of a stable outside world. It is not that. It is an instrument that catalogs vulnerabilities and, for a meaningful subset of them, also causes the exploitation it is trying to prevent — with a measurable lag of about five hours.
If that sentence sounds like hyperbole, stay with me. By the end of this article I want you to have in your head three ideas: what the five hours means, why the rest of the metric is mixed in a way that nobody is disentangling, and what we would measure instead if we were serious about fixing this.
The lighthouse analogy
Imagine a lighthouse built to help ships navigate a dangerous coast. The beam is broadcast to every ship within range. Ships that see the beam and know how to read it — professionally captained, well-staffed, with updated charts — avoid the rocks. That is the point of the lighthouse.
But the beam is also visible from the land. And over the years, as the coast has grown more trafficked, a class of people has set up on the cliffs to watch the beam for different reasons. They use it to identify which ships are in which position, to time their predations against ships whose captains are distracted or whose crews are short-handed. The lighthouse was designed to help sailors. For a specific subset of watchers, it has become operational intelligence for the things the lighthouse was meant to warn against.
You cannot turn the lighthouse off. Without the beam, the ships that depend on it crash. You cannot make the beam selective — physics does not let you send photons only to friendly eyes. The lighthouse is simultaneously the best defensive tool available and a non-zero contribution to the risk it was built to mitigate. The ratio between the two effects depends on who is sailing, who is watching, and how fast each side can act on what they see.
That is the CVE program. A public catalog with descriptions, affected versions, and often links to proof-of-concept exploits is exactly what a defender needs to scan their own systems. It is also exactly what an attacker needs to scan everybody else’s. The two uses of the same information have been in rough balance for most of the program’s history. Recently, for a specific subset of the catalog, the balance has shifted in a direction that the topline number cannot show.
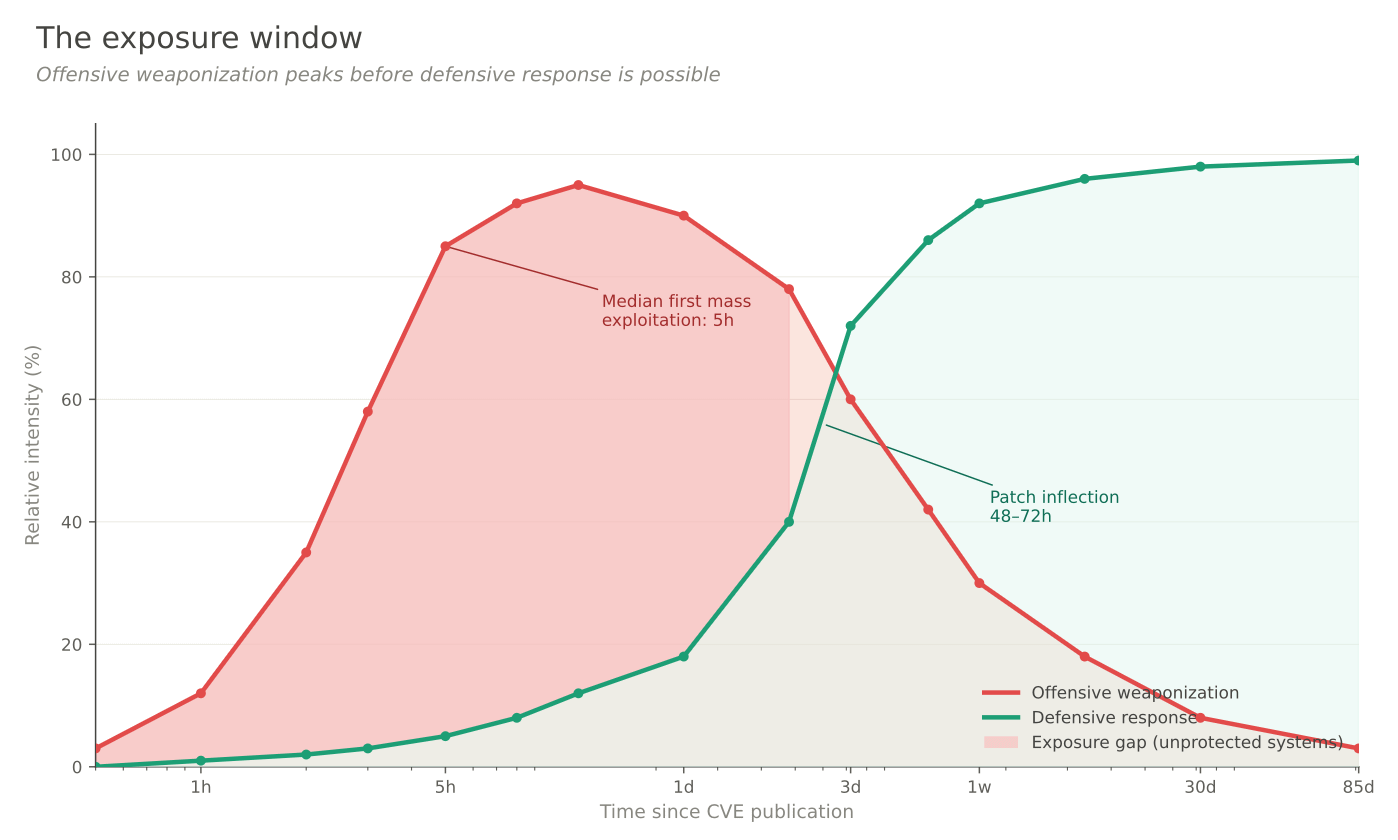
Five hours
Here is the fact that should be quoted every time someone writes a headline about CVE volume.
Patchstack’s 2026 State of WordPress Security report contains this sentence: the weighted median time from public disclosure to first mass exploitation of a WordPress plugin vulnerability is five hours.
Not five days. Five hours.
The same report documents that 52% of plugin developers do not ship a patch before the disclosure window closes. The coordinated disclosure process runs its standard timeline, the researcher gives the vendor 30 or 90 days, the CVE goes public — and more than half the time, the vulnerable version is still the only version available when the scanners start.
So the operational reality of a critical CVE in a popular ecosystem looks like this:
Hour 0: the CVE is published with description, affected versions, sometimes a PoC.
Hour 1 to 3: Nuclei template authors and Metasploit module maintainers integrate it. Shodan queries and Censys saved searches get updated.
Hour 5: median first mass-exploitation attempt against unpatched installations.
Hour 48 to 72: if the vendor was in the 48% who shipped a patch on time, auto-updating customers start being safe.
Day 30 and beyond: the long tail of unpatched installations continues being exploited. Qualys’s analysis of one billion remediation records puts the average window of exposure at 85 days.
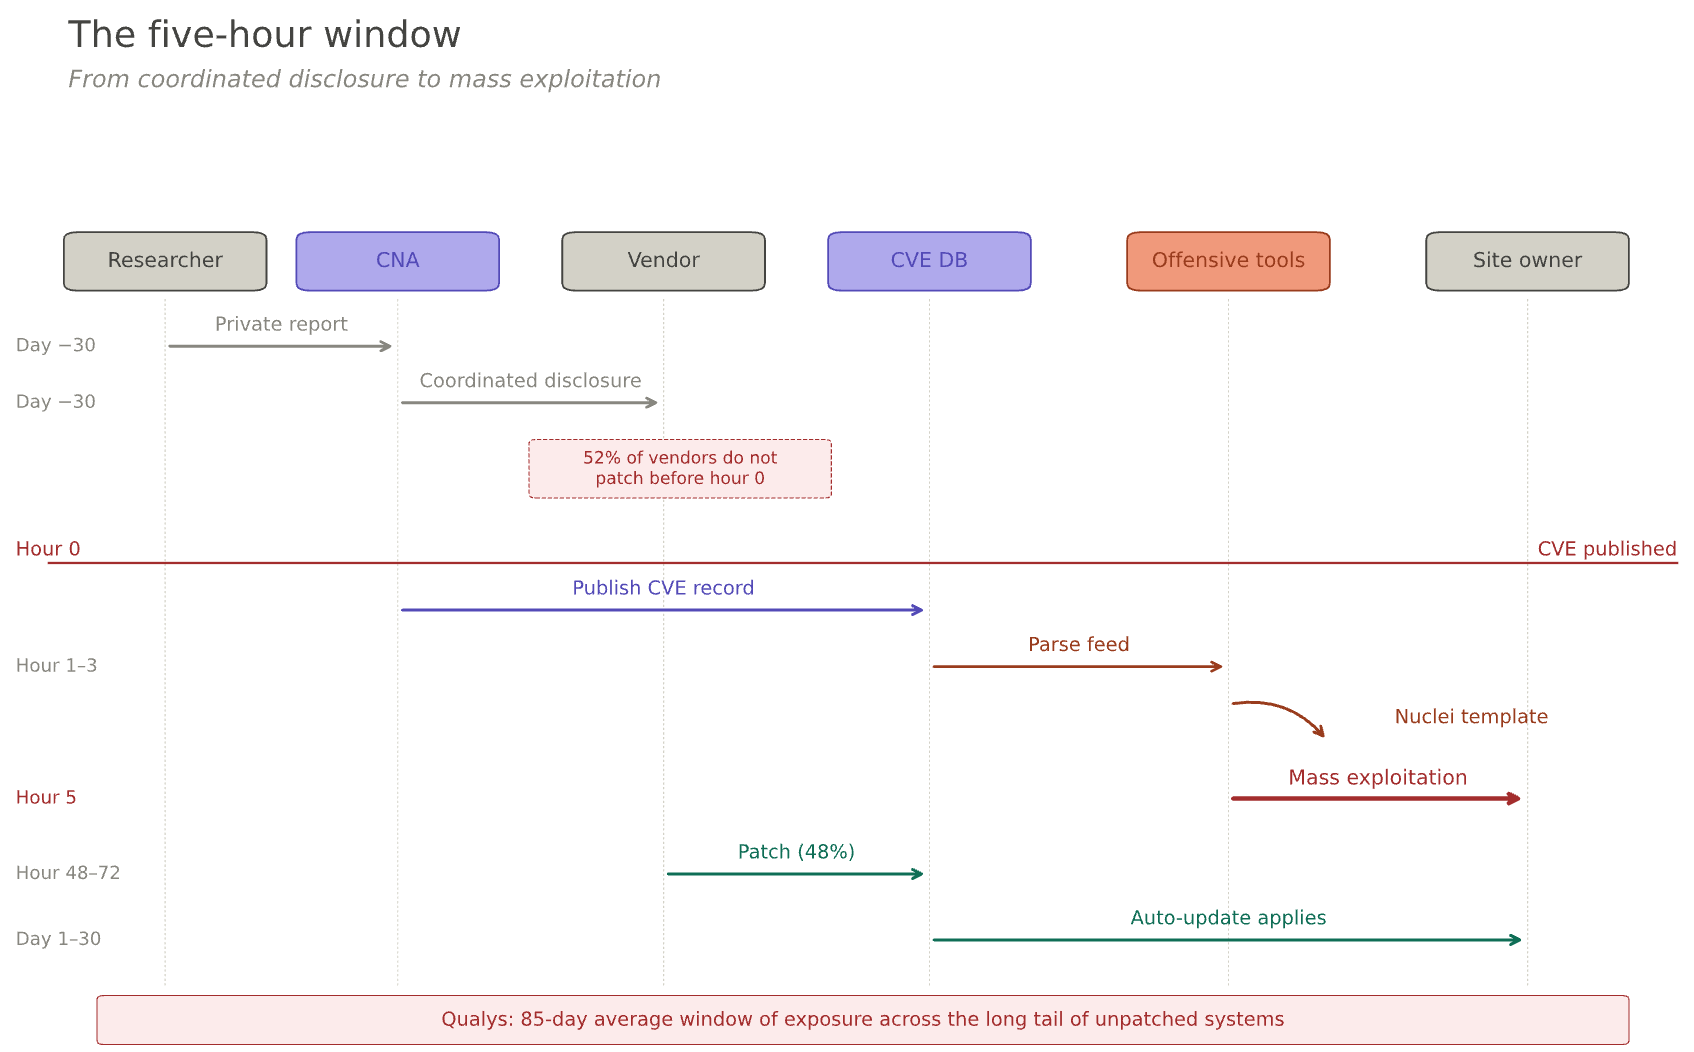
For the subset of CVEs that get weaponized, the public disclosure is the starting gun of a race that was not running before it fired.
I am not claiming every CVE has this property. VulnCheck’s analysis of a decade of data shows that only about 1.1% of published vulnerabilities are ever observed being exploited. Most of the catalog sits there, quietly, never weaponized. The lighthouse beam mostly helps sailors. The problem is that within the WordPress ecosystem, Patchstack reports 41% of H1 2025 vulnerabilities are “exploitable in real-life attacks” — and the WordPress ecosystem has grown to account for a significant share of the entire CVE catalog. The reflexive effect is concentrated, but the concentration is in the part of the catalog that has been growing fastest.
Reflexivity, and why this is not a normal measurement problem
There is a useful name for what is happening here, borrowed from a field where it has been studied for forty years: reflexivity.
The concept comes from George Soros, who built one of the most successful hedge funds in history partly by betting against the assumption that market prices passively reflect underlying fundamentals. His argument, developed across several books, is that prices and fundamentals form a feedback loop. Market participants observe prices, form beliefs about what assets are worth, and act on those beliefs — buying, selling, extending credit, hiring, investing. Those actions then change the underlying fundamentals that the prices were supposed to be measuring. A stock price that rises on optimism lets the company issue cheaper debt, hire more, expand faster, which then validates the higher price with fundamentals that the price itself helped create. The measurement modifies what is being measured. The loop runs until the gap between perception and reality becomes too large to sustain, and the whole thing corrects violently.
Soros’s point was not that markets are irrational. It was that markets are a particular kind of system — one where the observer and the observed are not separable — and that treating them as if they were a thermometer reading an independent reality produces the wrong conclusions. Traders who understand this, he argued, have a better model of what is happening than economists who assume efficient-market conditions.
The CVE program has the same structure. The cognitive function of the program is to describe the state of software security — what vulnerabilities exist, where, in what versions. The manipulative function, in Soros’s language, is what the disclosures do to that state once published: they change attacker behavior, defender behavior, economic incentives for researchers, the calculus of what is worth weaponizing. The two functions are not separate. Every CVE is simultaneously a description of a state of the world and an intervention into it. The industry has been reading the CVE count as if only the cognitive function existed.
There is one important place where the analogy to financial reflexivity breaks down, and it is worth naming. In markets, when the loop produces bad outcomes — a bubble bursts, a price corrects — the pain falls on the participants in proportion to their exposure. People who bought at the top lose the most. The feedback loop that creates the distortion is the same loop that punishes the participants who caused it. Markets are self-correcting, eventually, because the costs land on the decision-makers.
In the CVE ecosystem, the costs do not land on the decision-makers. When a disclosure creates a five-hour window during which unpatched systems get mass-exploited, the pain falls on the site owners running the vulnerable software, whose vendors did not ship a patch in time, and who had no voice in the disclosure decision. The CNA that published the CVE bears no cost. Its business model is, in fact, reinforced — every disclosure that produces exploitation is evidence that its work matters and generates demand for its products and services. The feedback loop that would normally self-correct a reflexive regime — decision-makers paying for their own bad calls — is broken here. The reflexivity is not just present; it is reflexivity with externalized costs, which is a worse configuration than anything Soros was describing in finance.
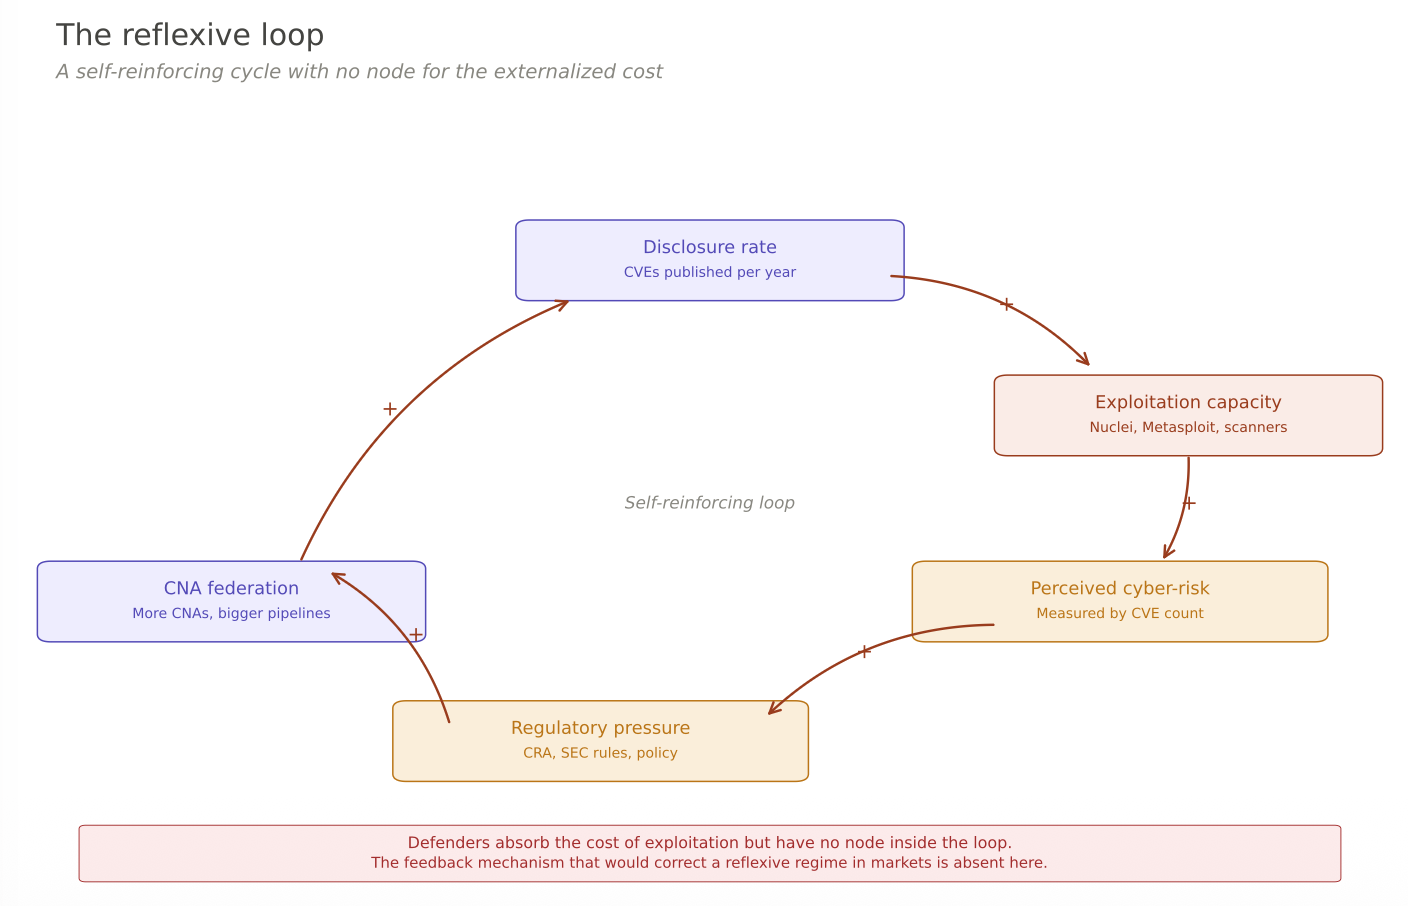
This is why “just fix the measurement” is not a sufficient answer. The problem is not that the CVE count is mismeasured. The problem is that the entire system — catalog, CNAs, disclosure norms, consumer tooling, regulatory frameworks — has been designed around the assumption that the catalog is a passive description of an independent reality, when in fact the catalog is part of the reality it describes, and a particularly consequential part for the subset of entries that get weaponized.
Once you see this, the CVE count stops looking like a thermometer that happens to be badly calibrated. It starts looking like a weight scale that measurably bends the floor it stands on. You can make the scale more accurate, and it still bends the floor. The answer is to stop putting all the weight on one scale.
Stock and flow
This is the distinction that the industry has not internalized, and without it the CVE count is almost impossible to read correctly.
Imagine the cybersecurity threat landscape as two different quantities.
The stock is the accumulated pool of everything exploitable at a given moment: CVEs from ten years ago against unpatched systems, stolen credentials from old breaches, misconfigurations, zero-days nobody has disclosed yet, shadow IT, defaults that were never changed. The stock is enormous. It is what attackers have been monetizing every day for as long as the internet has had commerce. The total exploitation pressure against internet-facing systems — the aggregate volume of malicious traffic that honeypots and network sensors observe — is overwhelmingly a function of this stock.
The flow is how fast new vulnerabilities enter the stock in a weaponized state. A CVE published today adds to the stock tomorrow, but there is a period — the five-hour window — during which the vulnerability transitions from “public description” to “actively used in mass exploitation.” That transition is the flow. How quickly it happens measures the efficiency of the offensive pipeline: how fast do attackers ingest a disclosure, integrate it into their tooling, and deploy it against the internet?
These are two completely different variables, and conflating them produces most of the confused commentary you read about CVEs.
A year with zero new CVE publications would still have enormous exploitation pressure, because the stock of existing exploitable systems is independent of whether anyone catalogs new vulnerabilities. A year with 100,000 new CVEs, but all against obscure software nobody runs, could have rapid weaponization velocity on paper and no measurable increase in real exploitation pressure, because nothing vulnerable is actually deployed at scale.
The CVE count, as currently published, does not distinguish between these two quantities. It does not tell you whether the stock is growing or the flow is accelerating. It does not tell you whether the new entries represent real additions to exploitable attack surface or administrative catch-up on vulnerabilities that already existed. It mixes them, reports the sum, and lets the interpretation fall wherever the reader’s priors take them.
Almost everything defenders actually care about lives in the stock, not in the flow. The number you should want to minimize is the volume of exploitable systems that are actually being exploited — stock in its operational state. The flow matters as a contributor to the stock, but a year where the flow accelerates does not necessarily mean the stock grew proportionally, and a year where the count explodes does not tell you whether what you are looking at is more stock, faster flow, or neither.
Where the growth actually came from
To see why this distinction matters in practice, it helps to look at where the CVE count has been growing. The headline — 14,647 CVEs in 2017, 48,185 in 2025 — is blunt. The breakdown underneath it is specific and, once you see it, hard to interpret as anything other than a story about administrative capacity catching up to vulnerabilities that were already there.
From 1999 through 2016, the CVE program was centralized. MITRE ran most of the cataloging as a single organization, and the annual volume hovered in a band between 4,000 and 7,000 CVEs per year for a decade. The number fluctuated with MITRE’s bandwidth more than with anything happening in the software ecosystem. A year where MITRE was short-staffed looked like a calm year for cybersecurity. It was not.
In 2016 the program pivoted. The CVE Board approved what was called the federated growth strategy: instead of MITRE being the bottleneck, any qualified organization could become a CVE Numbering Authority — a CNA — and assign CVE IDs within its own scope. The idea was sound. MITRE could not keep up with the volume of modern software, and many disclosures were sitting in limbo for months because researchers had no one to submit them to. The federation was a fix for a real administrative problem.
The effect on the count was immediate. CVEs jumped from 6,447 in 2016 to 14,647 in 2017 — a single-year increase of 127%. No reasonable person believes that software became 127% more vulnerable in twelve months. What happened is that a disclosure backlog that had been artificially suppressed by MITRE’s capacity constraints got released when the federation opened up alternative pipelines.
After 2017 the volume settled into a new regime: roughly 1,400 additional CVEs per year on average through 2021. Still growth, but orderly growth, consistent with what you might expect from a mature federated system cataloging a steadily expanding software ecosystem.
And then came 2022 to 2025. The slope changes abruptly. Additions per year jump to 5,000, then 7,000, then 11,000, then 8,000 again. The catalog nearly doubles in four years. If you were reading this sequence in isolation, you would conclude that something serious happened to software security between 2021 and 2025.
What actually happened is more specific. Five CNAs account for most of the growth, and four of them either did not exist as CNAs before 2021 or were too new to have meaningful volume yet. Patchstack and Wordfence were both designated CNAs in June 2021 to handle the WordPress plugin ecosystem. VulDB was designated at the end of 2021, with a focus on open-source research disclosures. The Linux Kernel team became its own CNA in February 2024. GitHub, which had been a CNA since 2019, scaled its output over the same period.
By 2025, these five organizations collectively published more than 24,000 CVEs in a single year — roughly half the entire program. Patchstack alone went from approximately 250 CVEs in 2022 to 7,007 in 2025, ranking first globally and outpacing Microsoft by a factor of eight. Wordfence went from roughly 200 CVEs in 2022 to 3,525 in 2024. The Linux Kernel CNA, which did not exist in 2023, published 4,325 CVEs in its first year and has kept pace since.
If you remove those five CNAs from the dataset, the rest of the ecosystem — Microsoft, Red Hat, Oracle, Cisco, Adobe, MITRE, the long tail of smaller vendor CNAs — compounds at roughly 6% per year over the same period. Six percent is approximately the growth rate of the software industry itself. The residual is boring. The residual is what you would expect from a mature ecosystem cataloging a slowly expanding attack surface.
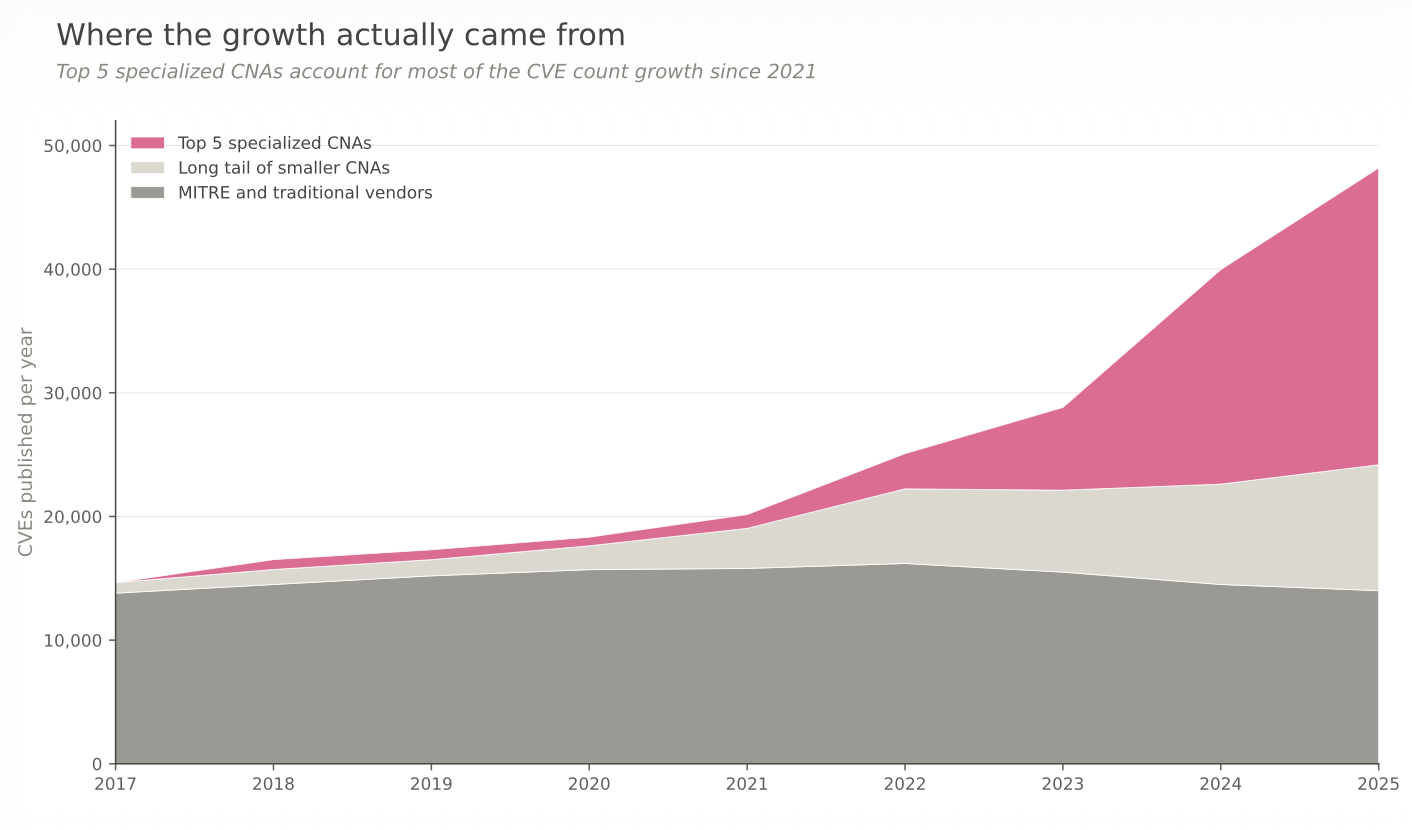
None of this is hidden. The CNAs themselves say it in their own publications, which is probably the most important detail. Wordfence’s 2024 State of WordPress Security report contains this sentence: “The process of obtaining a CVE ID was previously arduous and lengthy, requiring researchers to manage responsible disclosure independently. However, WordPress security companies like Wordfence, acting as CNAs, have streamlined this process, leading to a significant increase in WordPress vulnerability research over time.”
Read that carefully. The CNA responsible for a significant fraction of the CVE volume growth is telling you, on the record, that the growth is downstream of the process having become easier, not of more vulnerabilities coming into existence. Wordfence goes further and notes that 68% of the vulnerabilities they publish are considered low-risk for most site owners — cataloged things that, in the pre-federation era, would not have been worth the administrative overhead of obtaining a CVE identifier.
Patchstack tells the same story from a different angle. In their 2020 whitepaper, published before they became a CNA, they tracked 582 vulnerabilities in the WordPress ecosystem that year. Roughly 150 of those received CVE IDs under the old manual process. The other 432 existed and were documented in Patchstack’s internal database, but never entered the public count. By 2024, the same ecosystem produced 7,966 tracked vulnerabilities, and essentially all of them received CVE IDs. The conversion rate from “tracked vulnerability” to “CVE in the public database” went from roughly 25% to nearly 100% in four years.
That is not a cybersecurity crisis. That is a documentation catching-up event, concentrated in a few specific ecosystems — WordPress plugins, Linux kernel patches, GitHub-hosted open-source packages — where administrative capacity had been the binding constraint for years.
This is the part the topline CVE count does not show you. The 140% growth between 2021 and 2025 is not distributed across the catalog. It is concentrated in ecosystems that recently acquired dedicated CNAs, and the CNAs themselves attribute it to process improvements rather than to deteriorating software security. Anyone citing the growth rate as evidence of worsening cyber-risk is reading the topline without looking at the composition underneath it.
And yet the composition is where all the useful information is. The real questions are operational, not administrative. How much of the new catalog is actually being exploited? How fast does exploitation start once a CVE is published in the newly-covered ecosystems? How is the defender population responding? None of those questions is answered by the topline number, and all of them are answered — or at least answerable — by the three quantities I described above.
What a non-reflexive dashboard would look like
The reason this matters is that we do not lack alternatives. We lack the discipline to publish them in a form that is usable.
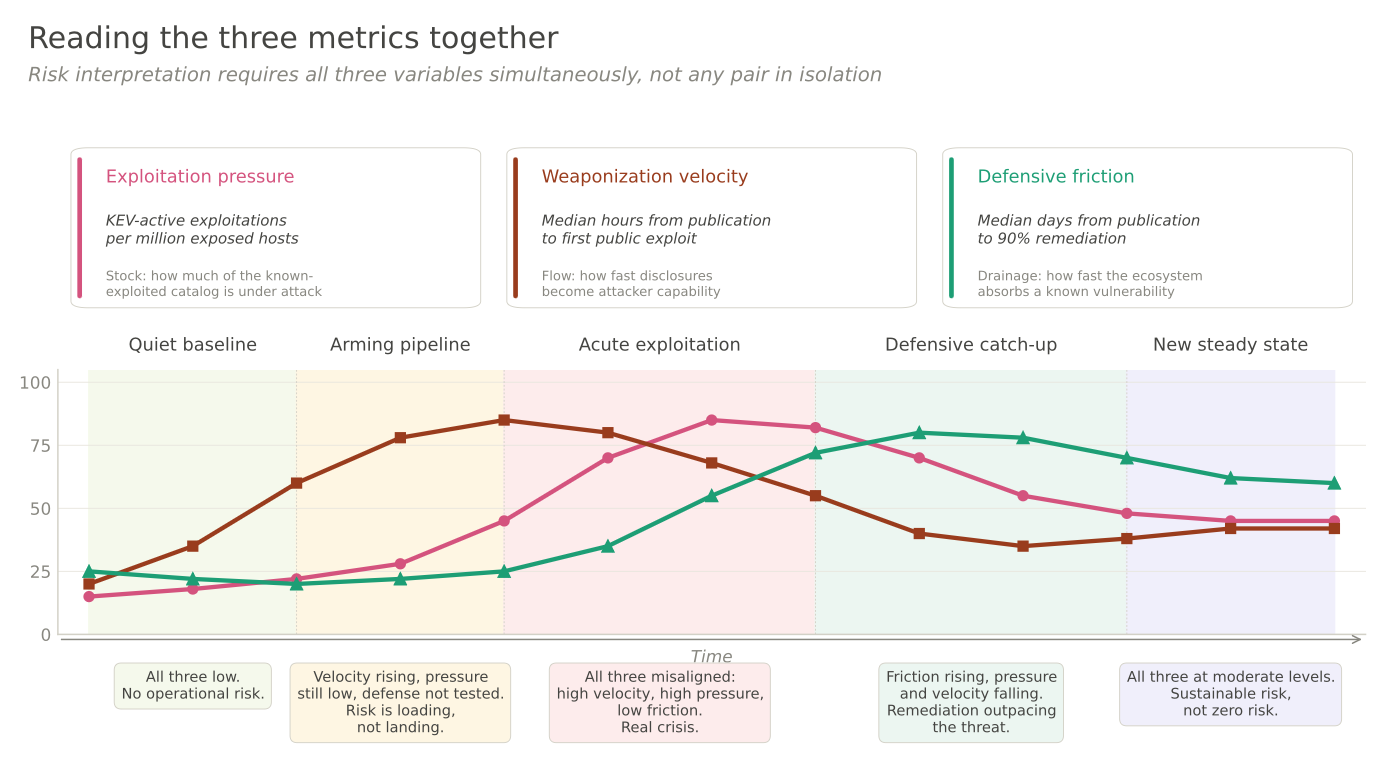
A serious cyber-risk dashboard would track three quantities that each move for reasons largely independent of the CVE catalog itself.
Exploitation pressure measures the stock in its active state: how much malicious traffic is actually hitting internet-facing assets, normalized per asset per month, segmented by industry. GreyNoise, ShadowServer, and national-level honeypot networks see this every day. They do not create the attempts; they observe them passively. A honeypot does not induce the attack it records — the attack would have happened whether the sensor was there or not. This is the closest thing the ecosystem has to a genuinely non-reflexive metric, and almost no policy conversation references it.
Weaponization velocity measures the flow efficiency: the median time from CVE publication to first mass-exploitation attempt, for critical vulnerabilities in popular software. This is the reflexive effect isolated and measured. Patchstack published the five-hour number once, for one ecosystem. We have no comparable number for Linux kernel CVEs, or for enterprise SaaS, or for network appliances. The number exists in the data that each of those ecosystems already collects; it is simply not published as a continuous time series.
Defensive friction measures how well the world responds once a known-exploited vulnerability has been cataloged: what percentage of the vulnerable population is still exposed 30 days after a CVE enters the CISA KEV list. Qualys has this across a billion remediation records. Mandiant has adjacent data in M-Trends. Neither organization publishes it at the resolution a regulator or a CISO would need.
These three quantities, read together, tell you what the CVE count by itself cannot. Exploitation pressure tells you how heavy the stock is. Weaponization velocity tells you how quickly the flow thickens it. Defensive friction tells you how fast the world drains it back down. They are correlated in discrete events — a specific CVE gets published, velocity fires, pressure spikes briefly against that CVE — but in aggregate they move for different reasons and respond to different interventions.
The reason we do not have this dashboard is not technical. The data exists, distributed across half a dozen organizations with different commercial incentives. The CVE count fills the vacuum because it is the only number everyone agrees to publish in the same format every year. The convention has become the signal, and the signal is reflexive.
Why this keeps happening
The deeper reason the CVE count persists as the industry’s default risk thermometer is that reflexivity is invisible when you only see the output. You read “48,000 CVEs in 2025, up from 28,000 in 2023,” and there is no footnote explaining which portion of the growth came from a new CNA being onboarded, which portion from existing CNAs scaling their pipelines, which portion from vulnerabilities being faster to weaponize than before, and which portion is real change in the underlying software. The topline number collapses all of that into a single figure that anyone can quote in five seconds.
The incentives to do that work are weak. Researchers produce volume because volume is what gets tracked. CNAs compete on volume because CNA scorecards are built around volume. Journalists quote the topline because the topline is the one that is published. Regulators build policy on CVE growth because CVE growth is the number they have. Nobody in the chain is specifically responsible for asking whether the metric is measuring what people think it is measuring. Everyone downstream assumes someone upstream checked. Nobody checked.
This is not unique to cybersecurity. Every industry has an indicator that accidentally became the conventional signal and that everyone now quotes without examining. GDP has this problem. Standardized test scores have it. Engagement metrics in software products have it. The pattern is always the same: a number that was designed for one purpose gets used for a dozen other purposes it was not designed for, and by the time anyone notices, the decisions that matter have been anchored to it for so long that challenging the anchor feels like an attack on the whole edifice.
The CVE count was designed to give defenders a common identifier for vulnerabilities so that security tools could interoperate. That was a good design for that purpose, and it still works. What it was never designed to do is answer the question “is cybersecurity getting worse?” — and the answer to that question is exactly what everyone has been using it to answer.
The operational implication
If you are a CISO, the practical takeaway is not optimistic. You cannot fix the reflexivity of the CVE catalog from your position. You can only stop organizing your program around it.
Separate vulnerability management into two pipelines with different tempos. The first handles the 99% of CVEs where disclosure is more defensive benefit than offensive cost — a normal cadence of prioritization, patching, and verification. The second handles the reflexive cases — the critical CVEs in software you actually run — on a tempo of hours, not days. That second pipeline is not a scan-faster problem. It is a virtual-patching, WAF-rule, compensating-controls, architectural-segmentation problem. It assumes the window between disclosure and exploitation is too short for a patch-and-deploy cycle to matter. It accepts that for the reflexive cases, you have to buy time for the patch to catch up.
For regulators drafting disclosure requirements based on CVE counts: please don’t. A threshold set at “X critical CVEs per year” either encourages volume, which inflates the reflexive component, or discourages disclosure, which pushes vulnerabilities back into the opaque-but-not-safer state. Anchor thresholds in exploitation telemetry or KEV entries. Those measure downstream outcomes rather than upstream cataloging decisions. They do not push CNAs to publish more or publish less. They measure what actually happens.
For vendors, CNAs, and anyone whose business model involves publishing vulnerabilities: every CVE published is an action that, for some fraction of the catalog, materially increases near-term risk to defenders who had no voice in the decision. That responsibility is not discharged by being technically correct. It is discharged by being well-timed, coordinated with the vendor, accompanied by mitigations where possible, and — for the worst cases — sometimes delayed beyond the standard window, even at the cost of a researcher’s publication credit.
Back to the macro problem
The reason any of this matters is that cybersecurity is increasingly a load-bearing public good, and the public good has to be governed somehow. Governance requires measurement. Regulators write policy based on what they can measure. Insurers price risk based on what they can measure. Boards approve cybersecurity budgets based on what they can measure. And right now, everyone in that chain is measuring the same thing — the CVE count — and it is the wrong thing to be measuring for the decisions being made.
The risk is not that we keep citing a flawed number. The risk is that we spend the next five years building governance infrastructure on top of it — the EU Cyber Resilience Act, SEC disclosure rules, national cybersecurity strategies, insurance underwriting models — and lock in a policy regime that treats a reflexive metric as if it were a passive one. Policies that are wrong but codified are much harder to fix than policies that are wrong but merely conventional.
What would help is not abandoning the CVE count. The catalog is useful, and the count is a fine administrative metric for the program itself. What would help is building and publishing the three non-reflexive quantities continuously, in a form that a regulator or a CISO can cite in place of the CVE count when the question is “is cyber-risk rising?”. Exploitation pressure, weaponization velocity, defensive friction. Stock, flow efficiency, drainage. Three numbers, updated quarterly, segmented by industry, published as a public good by whoever can coordinate it — CISA, ENISA, a cross-industry consortium, anyone.
Until that exists, the five-hour window is going to keep getting wider in the places that matter, the CVE count is going to keep getting quoted as if it meant something cleaner than it does, and every January we are going to have the same tired debate about whether cybersecurity is getting better or worse, measured against a number that is now partly a cause of the thing it is trying to describe.
Five hours. That is the real headline. And the reason it is not in anyone’s annual report is that it does not fit on a dashboard that was built for a different question.